Rows: 1,036
Columns: 11
$ SaleYear           <dbl> 2022, 2022, 2022, 2022, 2022, 2022, 2023, 2023, 202…
$ SaleType           <chr> "RecreationalMedical", "RecreationalRetail", "Recre…
$ County             <chr> "PACIFIC", "KING", "KING", "KING", "PACIFIC", "PACI…
$ DBA                <chr> "GREEN LABS", "ORIGINS", "ORIGINS", "ORIGINS", "GRE…
$ CapsuleSubcategory <chr> "Medical Ratio Capsule", "CBD Capsule", "CBN Sleep …
$ UnitsSold          <dbl> 1, 8, 61, 86, 2, 20, 1, 61, 88, 401, 5, 4, 28, 6, 7…
$ GrossRevenue       <dbl> 16.47, 81.54, 1037.00, 1023.22, 31.50, 205.05, 13.7…
$ TotalDiscount      <dbl> 0.00, 9.17, 93.73, 39.32, 0.00, 0.00, 0.00, 146.79,…
$ NetRevenue         <dbl> 16.47, 72.37, 943.27, 983.90, 31.50, 205.05, 13.79,…
$ AvgUnitPrice       <dbl> 16.470000, 10.192500, 17.000000, 12.910000, 15.7500…
$ DiscountRate       <dbl> 0.00000000, 0.11246014, 0.09038573, 0.03842771, 0.0…
Capsule Sales & Discounting Behavior in Washington
Annual Trends, Pricing Pressure, and Market Segmentation (2021–2025)
Capsule
Sales
Price
Discount
This analysis examines retail and wholesale sales of cannabis capsule products in Washington from 2021 through 2025. By linking sales transactions to product definitions and licensee metadata, the report evaluates how capsule pricing, discounting, and volume vary by business (DBA), county, and product subcategory. The goal is to understand whether capsules behave as a premium, medical, or commoditized segment within the broader cannabis market.
The Bottom Line Up Front
Capsule sales are geographically uneven and pricing is influenced more by local retail competition than by statewide supply dynamics since it was found that rural markets exhibit less discounting, likely reflecting reduced competition and stable patient demand, Smaller counties show fewer transactions but comparable unit pricing, and King, Whatcom, and Pierce counties account for a disproportionate share of volume. Capsules sell consistently in both urban and rural counties, indicating stable baseline demand rather than trend-driven spikes.
Unlike novelty categories, capsule volume does not collapse during periods of market stress. Instead, it behaves more like a low-volatility product class, suggesting loyalty among repeat consumers and predictable restocking by retailers.
Overview
Cannabis capsules occupy a distinct niche in Washington’s regulated market. Unlike inhalable products, capsules are dosage-controlled, shelf-stable, and often positioned at the intersection of medical use and consumer wellness.
Yet questions persist: Are capsules premium products? Medical staples? Or increasingly commoditized SKUs subject to the same pricing pressure as flower and edibles?
The goal is to understand how pricing, discounting, and volume dynamics vary across counties, businesses (DBAs), and capsule subcategories—and what those patterns suggest about capsules’ role in Washington’s cannabis economy.
The Data Behind the Analysis
This report draws from multiple CCRS tables, including:
94.6 million retail sale detail records, representing the Washington cannabis market
44,895 capsule-specific transactions, isolated by inventory type and product metadata
24.9 million inventory records, linking sales to product origin and ownership
6,800+ active licensees, mapped to DBAs and counties
21,900 capsule products, classified by functional subcategory (THC, CBD, medical ratio, sleep, etc.)
All pricing metrics reflect transaction-level data, including unit price, discount applied, gross revenue, and net revenue after discounts.
We used the product name keywords to categorize capsule products:
| Subcategory | Logic |
|---|---|
| THC Capsule | Default capsule |
| CBD Capsule | Name contains CBD |
| CBN / Sleep | CBN, sleep, night |
| Microdose | micro, low dose, <5mg |
| Medical / Ratio | ratio, 1:1, medical |
| Other Capsule | Fallback |
Core Summary: DBA × County × Year × Subcategory
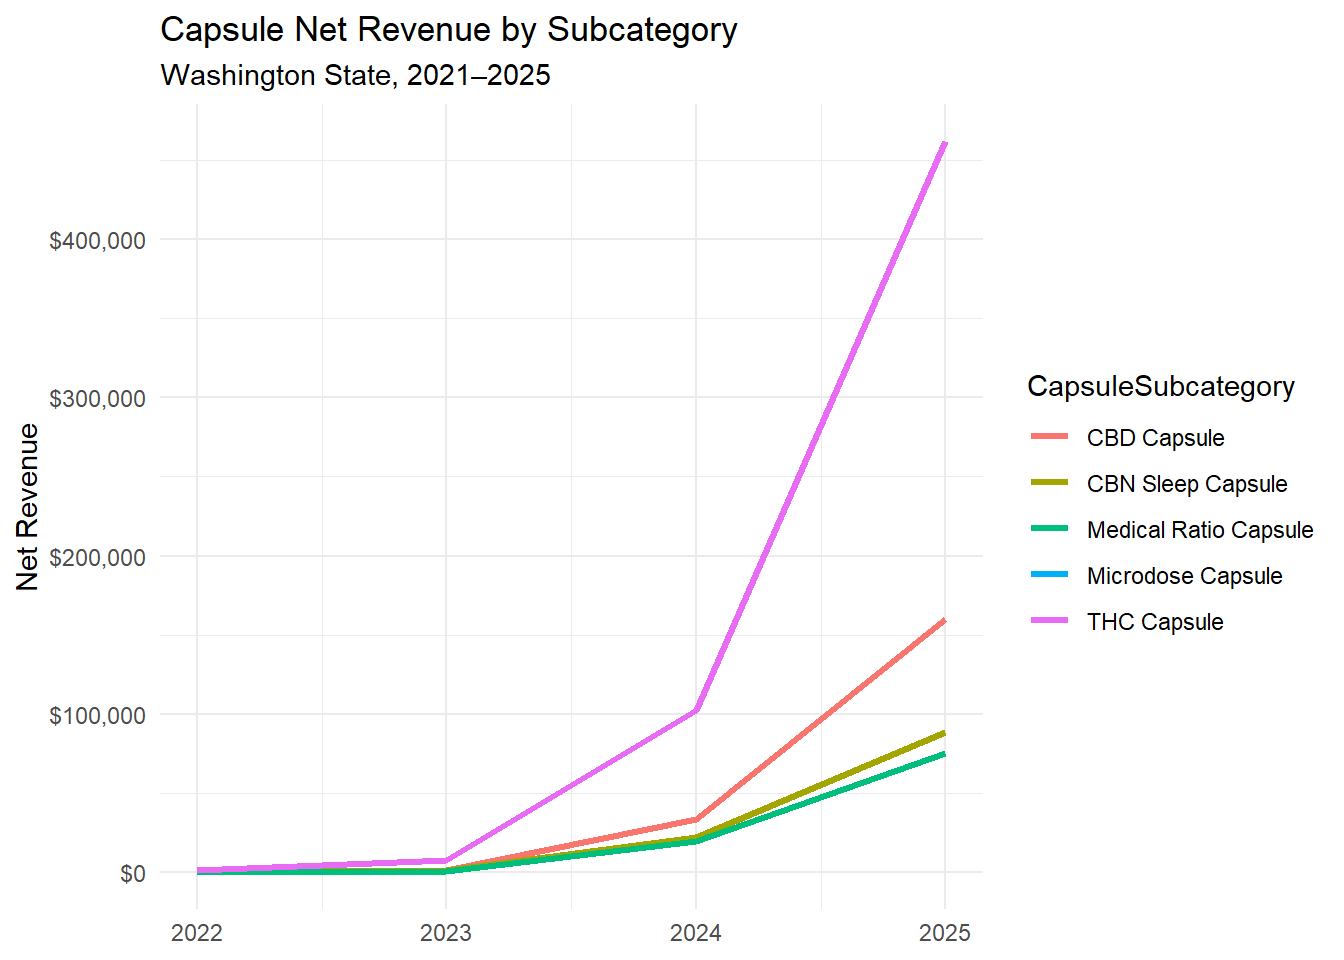
Capsule Sales by Subcategory (Statewide)
Pricing Patterns: Neither Luxury nor Bargain Bin
Unit Prices Reflect a Middle-Tier Product
Across the study period, capsule unit prices cluster in the mid-teens to low-twenties, with meaningful variation by:
capsule subcategory
brand/DBA
and county
THC capsules and sleep-oriented formulations generally command higher prices than CBD-only products, while medical ratio capsules sit between the two.
Importantly, capsule pricing does not exhibit the extreme compression seen in flower markets, nor the aggressive premiumization observed in solventless concentrates.
Discount Intensity Over Time
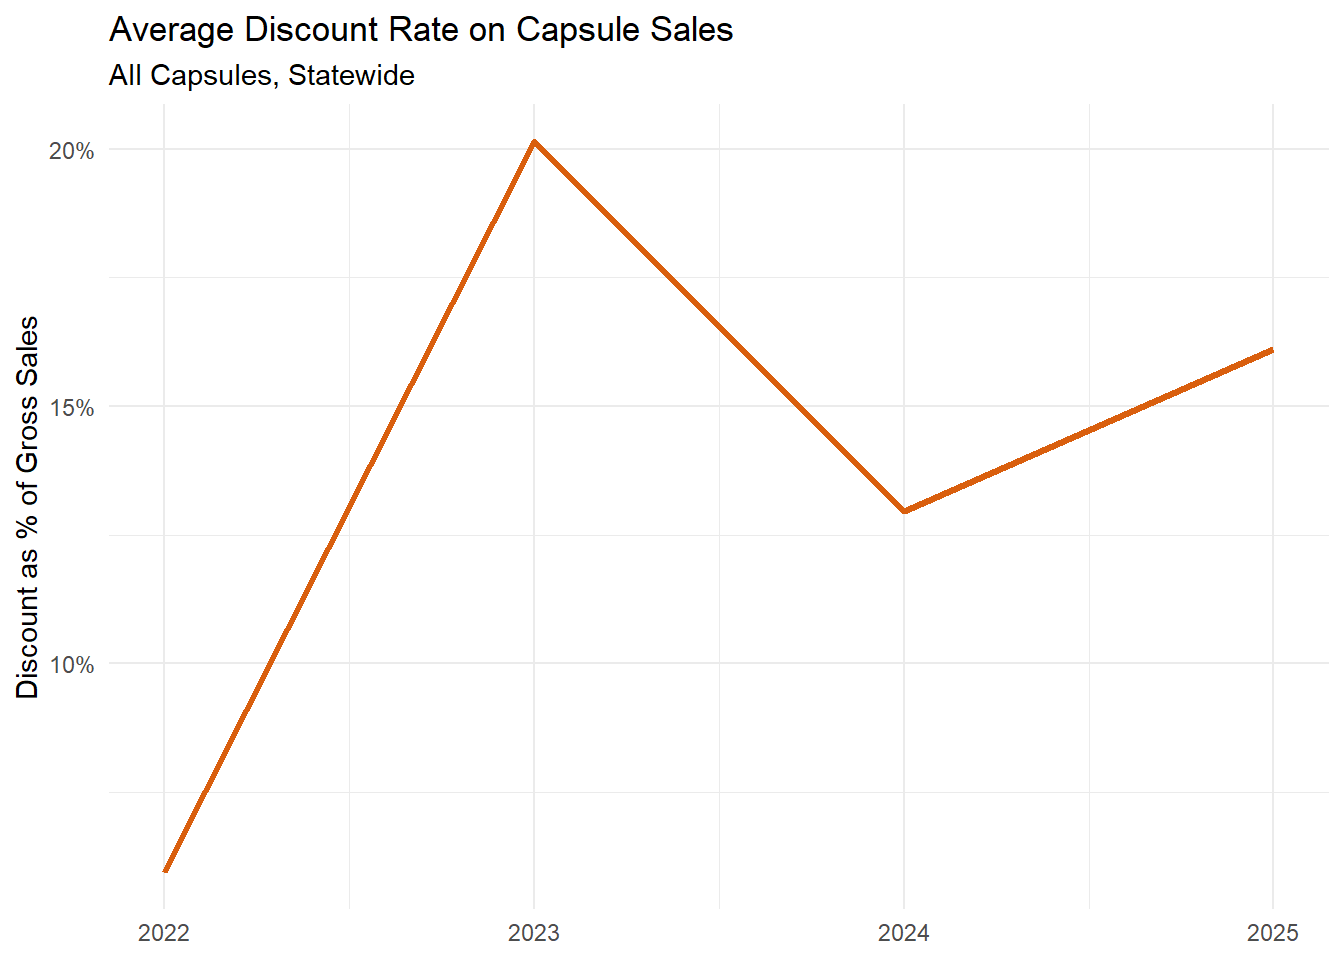
Discounting Behavior: Selective, Not Universal
Capsules are discounted—but not indiscriminately.
Key patterns emerge:
Discounts are common but targeted, rather than perpetual
Average discount rates vary significantly by DBA and subcategory
Medical ratio capsules show lower discount frequency than recreational THC capsules
Counties with high retail density exhibit more aggressive discounting, suggesting competitive pressure rather than oversupply
Notably, discounting does not appear to be the primary driver of capsule sales volume. Many capsule SKUs sell steadily with minimal or zero discounting, reinforcing their positioning as functional, necessity-oriented products rather than impulse purchases.
Business Strategy: DBA Behavior Shapes the Market
At the DBA level, capsule sales strategies diverge clearly:
Some operators treat capsules as premium adjunct products, maintaining higher prices and minimal discounts
Others use capsules as bundled or discounted add-ons, especially in high-traffic retail environments
Vertically integrated operators tend to exhibit more consistent pricing across counties
This heterogeneity indicates that capsules are not governed by a single market logic. Instead, they reflect operator intent and customer base more than wholesale cost pressure.
How do capsule discounts differ between retail and wholesale?
Subcategory Segmentation: Capsules Are Not One Market
Breaking capsules into functional subcategories reveals important distinctions:
1. THC Capsules + Higher volume, higher discounting, more price competition
- Medical Ratio Capsules
- Lower volume, higher price stability, minimal discounting
- Sleep / CBN Capsules
- Premium-leaning, smaller batch sizes, higher average unit prices
- CBD Capsules
- Price-sensitive, more exposed to substitution from non-cannabis wellness products
These differences suggest capsules function as multiple micro-markets, not a single homogeneous category.
Why This Matters
For operators, capsule data highlights where pricing discipline still works.
For retailers, it shows how capsules can anchor consistent margin products.
For policymakers and analysts, capsules offer a rare example of a regulated cannabis product class with low volatility and high predictability.
Most importantly, this analysis demonstrates the value of open CCRS data: even niche categories reveal deep insights when transaction-level records are made transparent and accessible.
This analysis is part of the Evergreen Canna Ledger’s ongoing effort to document Washington’s cannabis market using public, reproducible data. Feedback, replication, and discussion are encouraged.
Join the Discussion
Your insights help drive better transparency and smarter policy in Washington’s cannabis industry.