Encapsulated Flow: Mapping Transport Flows in Washington’s Capsule Market
Production Cycles and Distribution Patterns (2021–2025)
Capsule
Supply Chain
Transportation
4Years
This analysis examines the movement of cannabis capsule products within Washington’s regulated supply chain. Capsule-specific trends reveal where losses, bottlenecks, and high-volume transfer hubs emerge among licensees, offering actionable insight into capsule operations and regulatory oversight.
The Bottom Line Up Front
The Market Is Concentrated but Stable - a small number of origin licensees anchor capsule distribution statewide. This concentration introduces dependency risk, but also suggests operational maturity. Capsule distribution favors localized production-to-retail loops, likely driven by predictable demand, shelf stability, limited wholesale arbitrage, and higher regulatory scrutiny relative to inhaler products.
Overview
Capsules occupy a unique position in Washington’s cannabis market. They are non-inhalable, dosage-controlled, medically adjacent, and operationally conservative compared to flower or concentrates. Yet, despite their relatively modest market share, capsule products generate a rich and revealing transportation footprint inside the state’s seed-to-sale system.
Using CCRS transport manifests, inventory records, and adjustment logs, this analysis traces how capsule products move across Washington, from origin licensees through distribution corridors to retail destinations. The result is a detailed look at logistics behavior, regional hubs, and supply chain concentration for one of the market’s most compliance-sensitive product types.
Licensee-Level Capsule Flow Summary
Who ships capsules to whom, and how much?
Who Ships Capsules at Scale
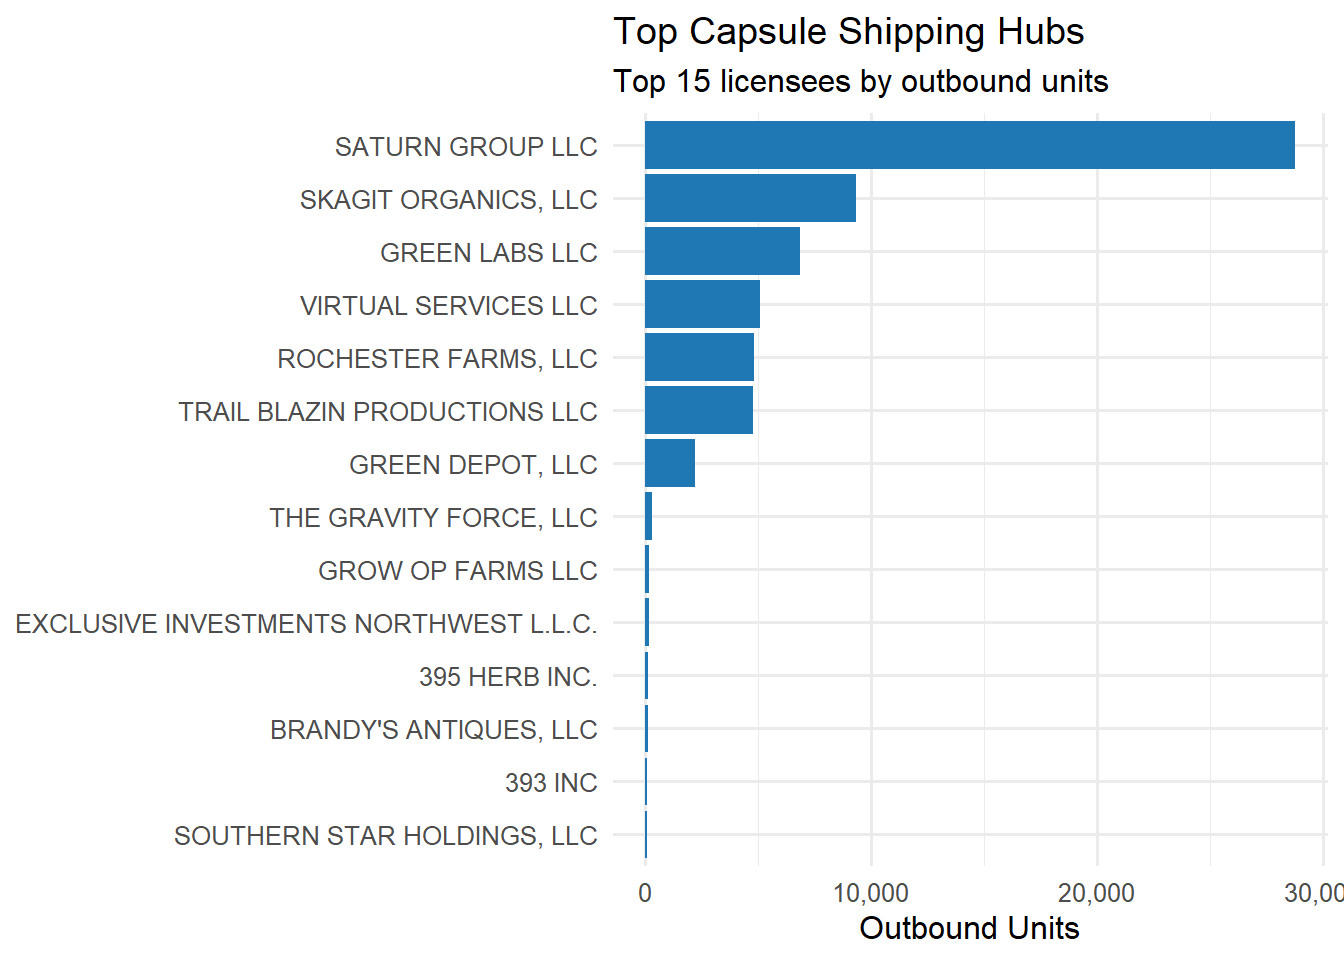
High-Volume Capsule Hubs
Licensee Hubs: Few Origins, Many Destinations
Outbound shipment data reveals a hub-and-spoke structure:
- Just 32 origin licensees function as major capsule hubs
- Some hubs ship to nearly 200 trading partners
- Others operate as vertically aligned loops, shipping primarily to themselves or affiliates
The largest hubs are not necessarily the largest producers by volume, but rather those with:
- stable SKUs,
- repeatable packaging formats,
- and consistent compliance performance.
This structure reduces transport complexity but increases network dependency on a small set of operators.
What These Tables Tell Us About the Capsule Market - capsules are a logistics-conservative product
Capsule supply chains favor:
short distances,
known partners,
predictable demand,
and compliance stability.
They behave more like regulated consumer health products than traditional cannabis SKUs.
“Lane Drilldown” tables (for compliance traceability)
Mapping Capsule Transport Routes
Transport Data Reveals Strategy, Not Just Movement - even without pricing or margin data, transport flows expose:
- vertical integration strategies,
- geographic retail footprints,
- and regional demand consistency.